UT Austin acceptance rate: the latest complete cohort
The latest complete CDS cohort supports 22.22% for Fall 2025. New Fall 2026 application and enrollment counts do not provide a newer admission rate.
In this guide
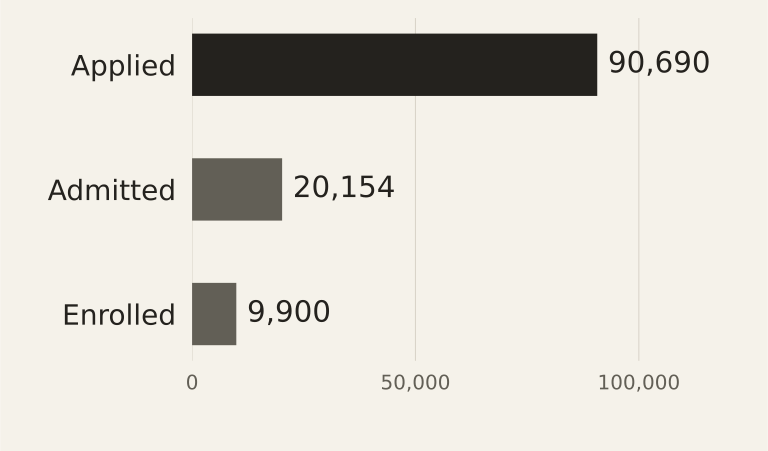
UT Austin’s latest complete published CDS cohort supports a 22.22% first-year acceptance rate for Fall 2025: 20,154 admitted applicants divided by 90,690 applicants. UT’s newer Fall 2026 announcement reports applications and enrollment without an offers count, so it does not establish a Fall 2026 acceptance rate. Official CDS index, Fall 2026 announcement
Acceptance rate means offers divided by applications for the same population and entering term. Enrolled students belong to a later stage; keep first-year, external-transfer, internal-transfer, McCombs BBA and graduate figures separate.
University primary sources and delivered CDS rows checked October 27, 2026. Fall 2025 rate and yield are authored calculations from matching counts; Fall 2026 offers remain unavailable in the cited announcement. Population, cohort and residency stay explicit; no personal admission probability is inferred.
The latest supported rates, with their missing fields
The 2025–26 CDS describes Fall 2025 entry. Its C1 table supplies the first-year counts; D2 supplies the separate external-transfer cohort. The PDF page numbers are 14 and 24. Use the admitted column as the numerator, not the number who ultimately enrolled.
For Fall 2026, UT reports 98,841 freshman applications and an entering first-time-in-college class of 9,487. The announcement does not publish an offers count. A quotient made from those two numbers would describe enrollment relative to applications, not acceptance.
The total retains every reported C1 sex category, including the source’s Unknown category: 32 applicants and one admit (C1, PDF page13). That is a different classification from residency, whose Unknown column reports zero. Do not drop a small category or substitute one table’s unknown count for another.
Scroll the table to compare every column.
| Entering cohort | Applicants | Admitted | Acceptance rate |
|---|---|---|---|
| Fall 2025 · first-time, first-year | 90,690 | 20,154 | 22.22% |
| Fall 2025 · degree-seeking external transfer | 12,168 | 2,672 | 21.96% |
| Fall 2026 · first-time-in-college | 98,841 | Not supplied in the announcement | Not calculated |
Rates are authored admitted/applicant calculations, rounded to two decimals. C1 and D2 are different populations. The Fall 2026 news item is not a complete admission-rate dataset.
Why the entering class produces a different percentage
The first-year report records 9,900 enrolled students. Dividing that count by 90,690 applicants gives about 10.92%. That is the share of applicants who enrolled, not the acceptance rate: some admitted applicants chose another destination.
Dividing the same 9,900 enrollees by 20,154 admitted applicants gives a yield of about 49.12%. Yield answers how many admitted students enrolled. Label the numerator and denominator before comparing a percentage from another college guide.
UT’s September 2025 enrollment announcement independently reports 9,900 first-time-in-college students and an updated 90,690 freshman applications. It notes that the application count was revised from an earlier 90,562. A December application headline and the later census should not be mixed into one calculation. Enrollment announcement
Compared with the revised 90,690 Fall 2025 application count, 98,841 in Fall 2026 is an 8.99% increase. The entering-class count changed from 9,900 to 9,487, a 4.17% decrease. These are original changes calculated from the two university releases; neither supplies the missing Fall 2026 offers denominator/numerator pair.
The Fall 2025 residency columns answer different questions
C1 separately reports in-state, out-of-state, international and unknown residency. The published counts below reconcile to the overall first-year totals. Out-of-state excludes the separately reported international column; combining those populations would produce a different statistic.
These are original admitted/applicant calculations from the institutional table, rounded to two decimals. They describe the reported groups, not an automatic-admit/non-automatic-admit breakdown, a McCombs rate or an individual probability.
Scroll the table to compare every column.
| C1 residency group | Applicants | Admitted | Enrolled | Admitted ÷ applicants |
|---|---|---|---|---|
| In-state | 46,879 | 16,828 | 8,958 | 35.90% |
| Out-of-state | 35,268 | 2,653 | 758 | 7.52% |
| International | 8,543 | 673 | 184 | 7.88% |
| Unknown | 0 | 0 | 0 | Not defined (zero applicants) |
2025–26 Common Data Set, C1, PDF page14; entering Fall2025. Public source checked October27,2026. Unknown0/0/0 is a reported row; it is not evidence that unrelated missing fields are zero.
Automatic admission and major selection need their own context
UT’s review page lists top-5% class-rank thresholds for eligible Summer/Fall 2027 and Spring 2028 freshman applicants, with the required eligibility conditions. Read those conditions for the relevant entry term; a class-rank threshold is not the percentage of all applicants admitted. Current review and automatic-admission rules
The overall rate combines different applicant groups. Read the CDS C1 residency columns separately; an overall percentage is not an out-of-state or international rate. Automatic-admission eligibility, the non-automatic review pool and the competitiveness of the selected major are further distinctions.
Major selection is part of UT’s review process. Before turning a university-level percentage into a claim about a particular program, find a program-specific source with a defined year and applicant group.
A transfer rate is not an easier-admission shortcut
The transfer and first-year rates above are numerically close, but the pools are different. Transfer candidates bring college coursework and apply under transfer requirements. Their cohort rate does not measure what would happen if a particular freshman applicant waited and reapplied.
Keep external transfer separate from internal transfer by a student already enrolled at UT. The maintained McCombs internal-transfer guide follows that different process and its official sources.
For an application decision, use the current program’s prerequisites, required materials and entry term. The historical table is useful context for selectivity; it does not replace that checklist.
McCombs publishes a separate 2025 BBA figure, discussed in the BBA acceptance guide. The Graduate School admissions dashboard describes graduate populations. Neither is a replacement for this university-wide undergraduate cohort.
Use the current application cycle after the historical comparison
For a new first-year application, use UT’s current freshman checklist and MyStatus to distinguish submitted materials from a completed file. The review page gives the applicable automatic-admission cohort and separates major selection from the university admission decision.
Then compare the 2026–27 tuition and attendance budget, your intended program and an affordable alternative. A cohort percentage describes what happened to that reported pool; it is not a personal application forecast.
Use the rate for context, then plan the actual decision
An applicant can use the cohort and source date to make comparisons consistently, then investigate the academic program and financial commitment. The UT cost-of-attendance guide separates the university’s budget estimate from a tuition bill and a housing contract.
Students preparing to enroll can move to registration and waitlists and degree-audit planning. Those guides address the decisions that follow admission without treating a historical acceptance rate as a personal probability.
Questions answered
What is the latest official UT Austin acceptance rate, and which class does it describe?
The latest complete CDS cohort used here gives 22.22% for Fall 2025 first-year entry: 20,154 admitted applicants divided by 90,690 applicants. Fall 2026 news gives applications and enrollment, but no offers count for a newer rate.
Official CDS · Checked 2026-10-27
Fall 2026 announcement · Checked 2026-10-27
What changes for Texas residents, nonresidents and automatic admits?
For Fall 2025 first-year entry, CDS C1 supports 35.90% in-state (16,828/46,879), 7.52% out-of-state (2,653/35,268) and 7.88% international (673/8,543). International applicants are a separate column from out-of-state. Automatic admission has its own eligibility and entering-cycle rules; these residency rates are not that review-pool breakdown or a personal forecast.
CDS residency table, C1 · Checked 2026-10-27
Current UT review rules · Checked 2026-10-27
Does automatic admission guarantee my major?
No. Admission to the university and selection for a major are distinct decisions. Check the intended college’s current requirements and review process; the university-wide rate or a class-rank threshold does not guarantee a McCombs or other major offer.
UT review and major selection · Checked 2026-10-27
Why do online UT acceptance-rate figures disagree?
Common causes are different entering years or populations, a revised application count, an estimate, or using enrolled students instead of offers. For Fall 2025, enrolled/applicants is 10.92%, while admitted/applicants is 22.22%. Label both counts before comparing a headline.
CDS C1 counts · Checked 2026-10-27
Sources & dates
- UT CDS 2025–26 — C1 page 14 and D2 page 24Verified 2026-10-27
- UT Austin Institutional Reporting — official Common Data Set indexVerified 2026-10-26
- UT News — Fall 2025 enrollment and updated application countsVerified 2026-10-26
- UT Admissions — review, major selection and automatic admissionVerified 2026-10-27
- UT News — Fall 2026 applications and entering classVerified 2026-10-27
- UT Admissions — current freshman application checklistVerified 2026-10-27
Supporting material
- Download the cohort comparison
Original applicants/offers/enrollment calculations with the source, cohort, missing 2026 offers and check date.