West Campus safety: theft, serious reports and the map’s clock
West Campus had more APD property reports per resident than Austin overall, but fewer in four selected serious categories, during 2020–2024.
Research cutoff: . Prices, budgets and results keep their own dates.
In this investigation
West Campus had more APD theft, burglary and auto-theft reports per resident than Austin overall during 2020–2024, but fewer reports in four selected serious categories. I would use those two findings to ask specific questions about a room, a car and a journey home, rather than choose housing from one safety grade.
There is another reason to read a crime map carefully: this research found that many map fields labeled as occurrence time matched the reporting time instead. A pattern of afternoon dots can describe when people filed reports, rather than when the incidents happened.
The neighborhood comparison
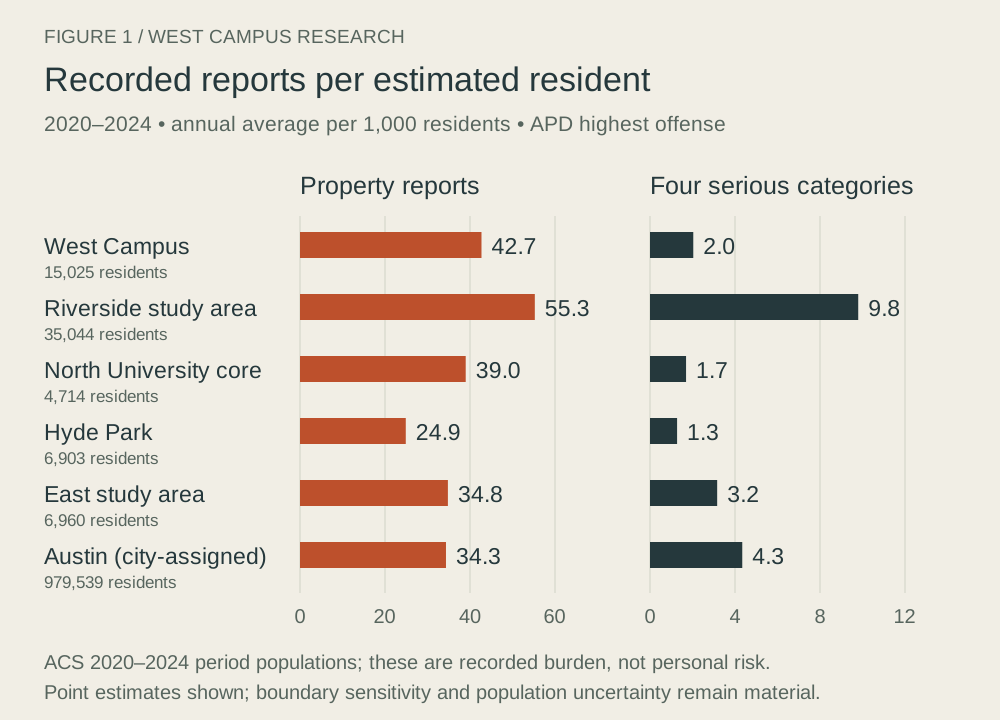
The table divides five years of APD reports by five and by estimated residents, then multiplies by 1,000. It uses the same whole census block groups for both reports and population.
| Defined study area | Estimated residents | Property reports, 2020–24 | Annual property reports per 1,000 residents | Selected serious reports, 2020–24 | Annual selected serious reports per 1,000 |
|---|---|---|---|---|---|
| West Campus | 15,025 | 3,208 | 42.7 | 153 | 2.0 |
| North University core | 4,714 | 919 | 39.0 | 40 | 1.7 |
| Hyde Park | 6,903 | 859 | 24.9 | 44 | 1.3 |
| Riverside/Parker Lane/Pleasant Valley | 35,044 | 9,681 | 55.3 | 1,717 | 9.8 |
| Blackland/Cherrywood/Chestnut | 6,960 | 1,211 | 34.8 | 110 | 3.2 |
| Austin comparison | 979,539 | 168,228 | 34.3 | 21,265 | 4.3 |
Property means theft, burglary and auto theft. The four selected serious categories are murder, rape, robbery and aggravated assault. Other harms, including harassment and non-aggravated assault, aren’t included in those two columns. APD’s incident dataset keeps the highest offense per report; this isn’t every offense, victim or agency’s incident total.
Population comes from the 2020–2024 ACS. These neighborhood burdens aren’t the chance that a student will be harmed on a particular walk. Visitors, parked vehicles, workers, reporting practices and UTPD coverage also matter.
Drawing North Campus differently can reverse its position
North University alone is below West Campus on the property-report measure. Adding Heritage and Hancock puts the expanded North Campus definition at 55.8 per 1,000, above West Campus’s 42.7. “North Campus is safer” skips a geographic choice that changes the answer.
West Campus’s higher property-report rate and lower selected-serious rate relative to Austin survive the tested geographic definitions. Riverside’s selected-serious comparison also remains higher. Hyde Park’s small serious counts and uncertain population argue against calling it the safest neighborhood from this table.
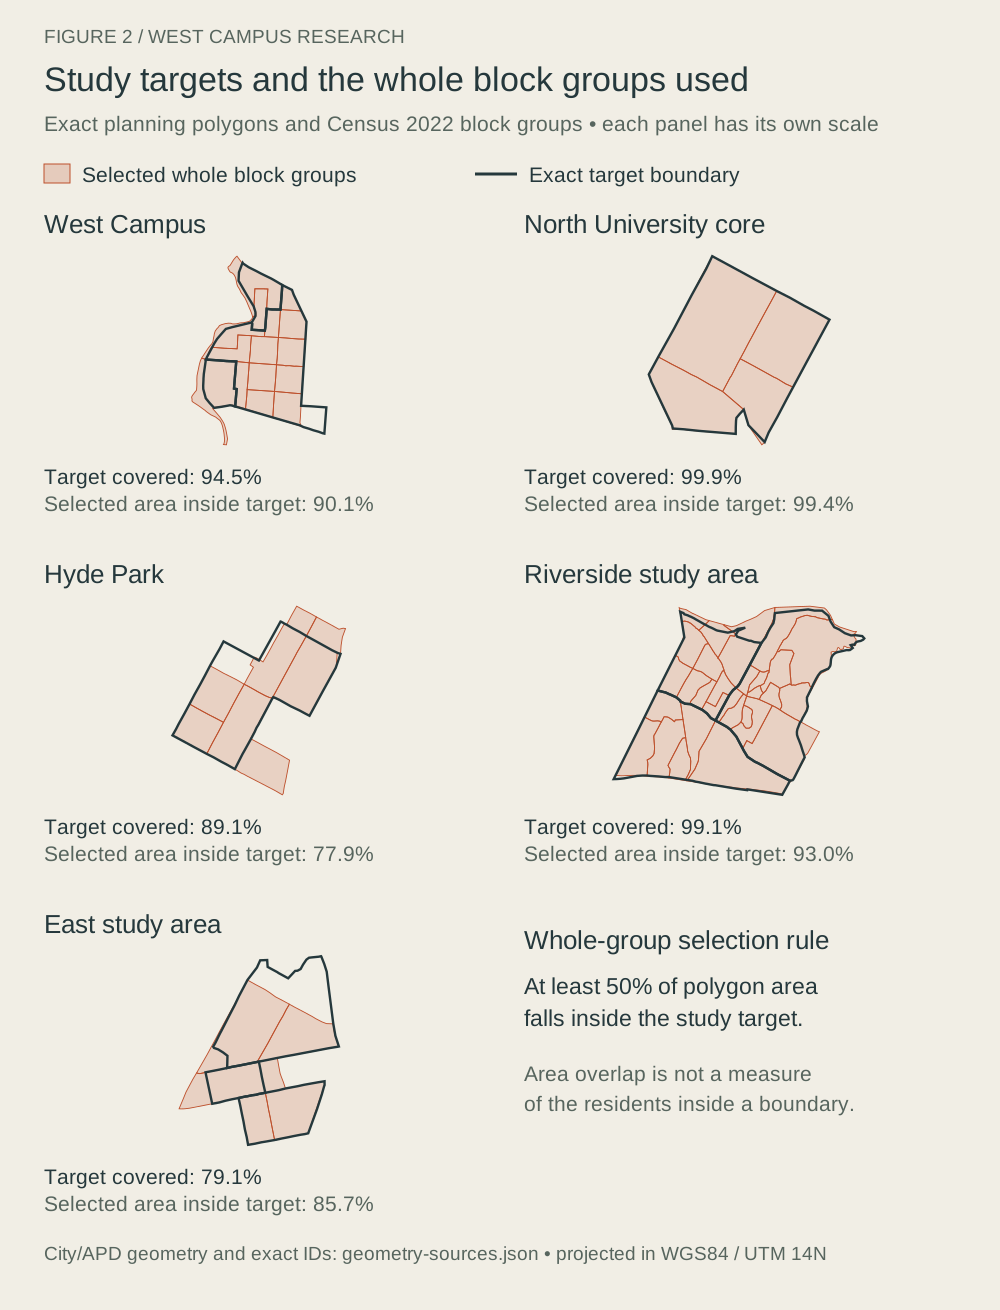
The study uses whole block groups selected by overlap with City planning areas. That aligns counts with population but leaves imperfect neighborhood edges. The full manuscript gives the chosen areas and the alternative calculations.
Dense dots don’t necessarily mean higher risk per resident
| Annual property reports, 2020–24 | West Campus | Riverside study area |
|---|---|---|
| Count | About 642 | About 1,936 |
| Per 1,000 estimated residents | 42.7 | 55.3 |
| Per square kilometer | 440.5 | 135.1 |
West Campus has about 3.3 times as many reports per square kilometer, while the resident-based comparison goes the other way. People and losses are concentrated in a smaller area. That explains how a map can feel much busier without showing the higher per-resident rate.
In the West Campus 2020–2024 property reports, 76.7% were classified at residences or parking facilities. Where you secure a bike or car, who can enter the building and how maintenance handles broken access controls are therefore concrete questions worth asking. The dataset doesn’t measure the effectiveness of a particular lock or security service.
Counts changed across the decade
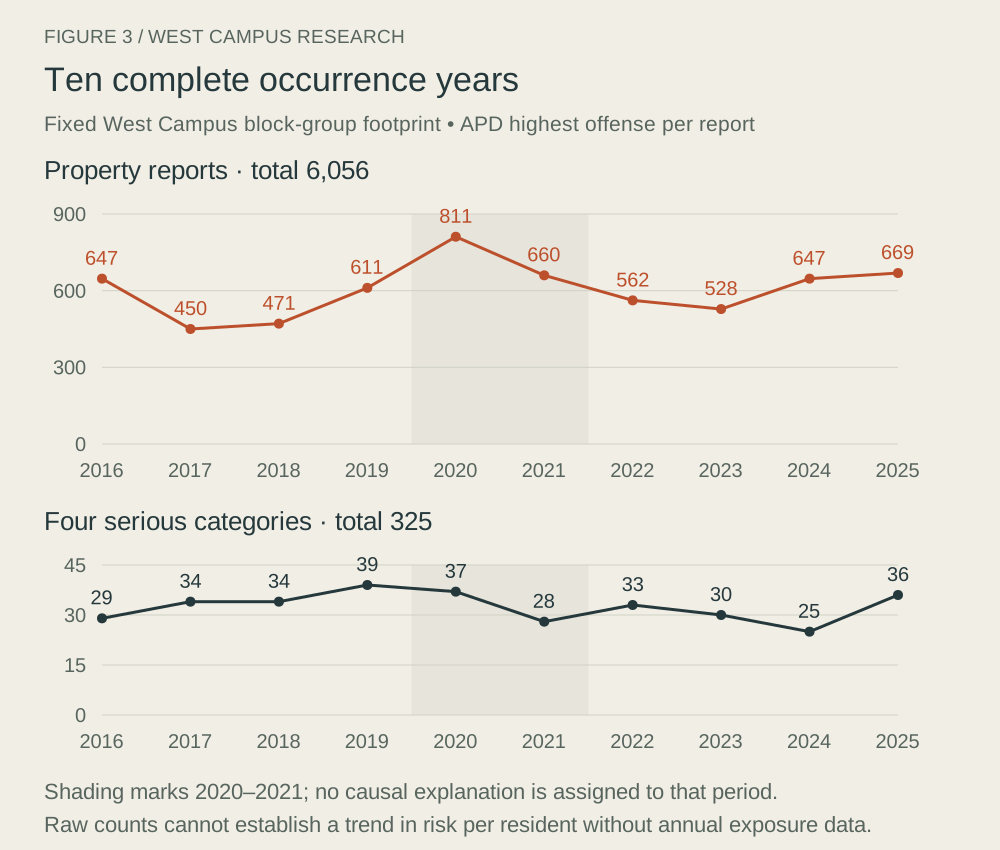
The ten-year counts don’t show a steady tower-era rise or decline. APD changed nonemergency reporting practices in 2021, and UTPD expanded its dedicated West Campus district in August 2025. Those changes can affect which agency holds a report. The data don’t isolate a causal effect of towers, lighting or patrols.
The busiest blocks weren’t most of the reports
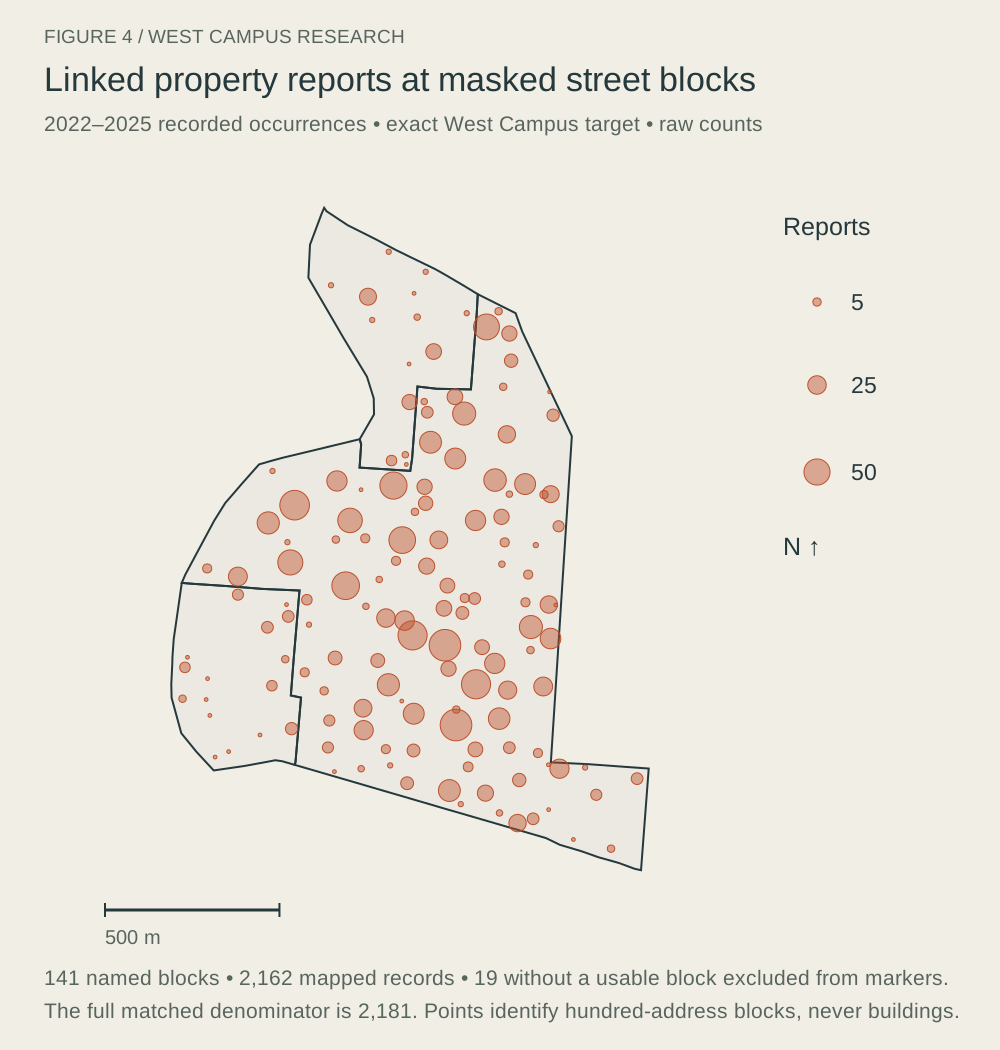
Among 2,181 recent linked West Campus property reports, the ten busiest blocks across 2022–2025 account for 27.1%. Choose the ten using only 2022–2023, then test them on 2024–2025, and their later share is 21.5%.
Concentration exists, but those results don’t support a handful of permanent danger spots explaining most property reports. The street points represent hundred-address blocks, not the building where an event occurred. Rape and several other categories aren’t in the mapped selection, and the recent street subset isn’t the ten-year census.
The reporting clock changes the apparent danger hour
The research conservatively linked 40,023 selected map entries to the incident table using offense, report minute and block group, with checks against ambiguous matches. In 31,489, or 78.7%, the map’s occurrence fields differed from the incident table’s occurrence fields and matched reporting time.
For the same 2,181 West Campus property reports, the map put eight in the 1 a.m. hour; the incident occurrence fields put 98 there. During 9 a.m.–4:59 p.m., the map showed 1,347, compared with 726 using occurrence time. The clock changed; the reports didn’t.
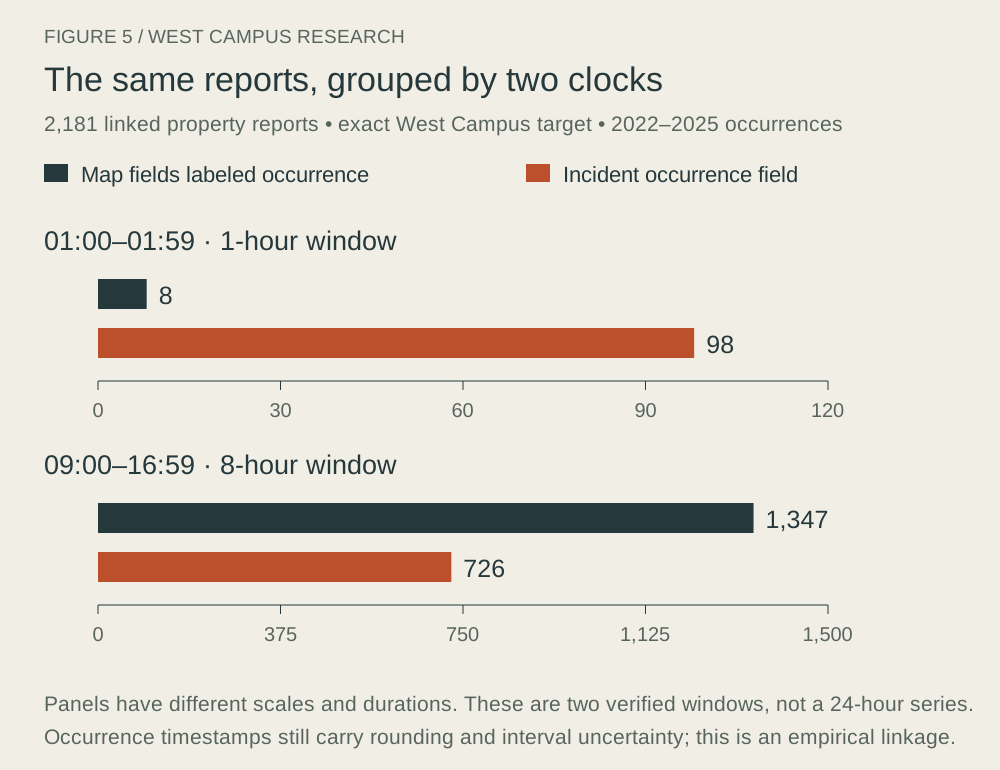
This is an empirical comparison, not an agency-certified matching key. The public City map services need that caution. A newer service also had a mislabeled assault layer; the research used the older verified assault layer instead.
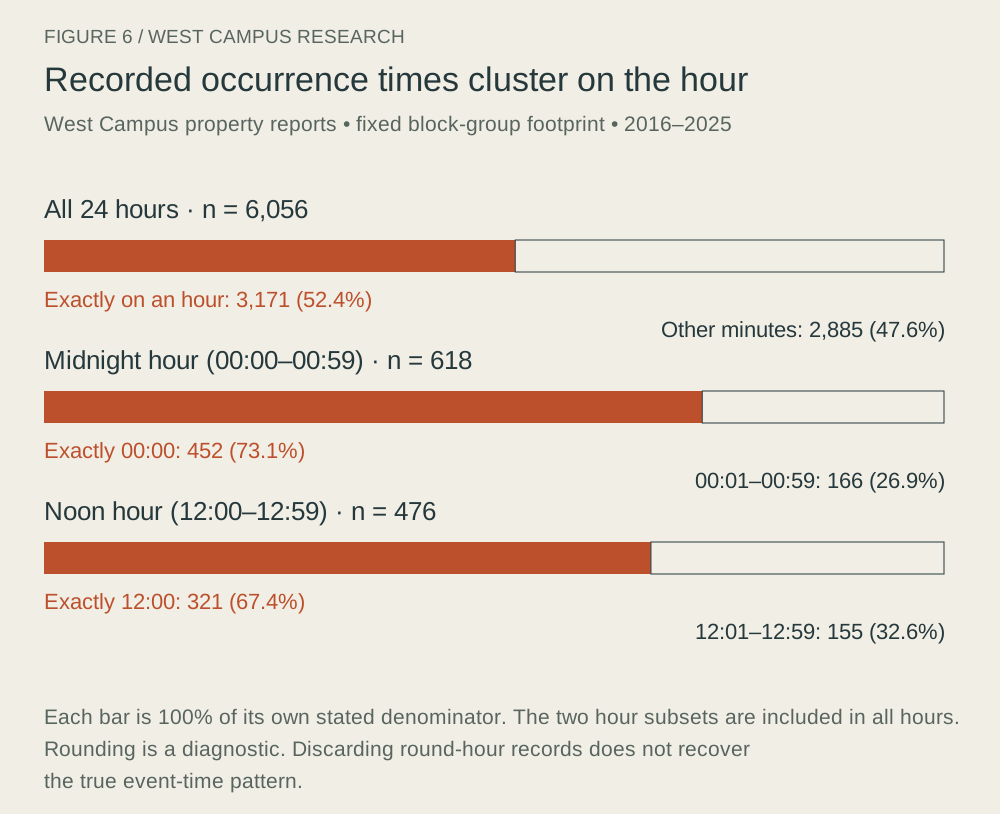
Even the incident occurrence times aren’t precise enough for an hourly route ranking. In West Campus’s ten-year property series, 52.4% landed exactly on the hour. About 44.4% were reported more than a calendar day after the listed occurrence date. Removing rounded times changes the pattern but could also discard valid events.
A plan after dark
Decide the trip before choosing a building: which entrance you use, where the bus drops you, how you get back from a late class and what you do if your first option fails. UT’s night-travel options have campus-origin and service-area rules; they aren’t a blanket ride from any off-campus address.
I would take both property theft and serious harm seriously without letting one color on a map choose my route. The main result is a more specific set of questions, with the map’s geographic and time limits visible.
How we got this
The November 2 research uses complete APD occurrence years 2016–2025, a matched 2020–2024 population comparison and shorter 2022–2025 street detail. Independent live APD queries reproduced 952,711 citywide reports for the decade and the West Campus headline counts of 3,208 property and 153 selected serious reports for 2020–2024. Population estimates, agency coverage and empirical time matching limit interpretation. The full manuscript below provides offense codes, geographic choices, raw counts, sensitivity checks and sources. A complete deduplicated APD–UTPD census and individual travel-risk estimates weren’t produced.
Data and source files
These downloads contain dated aggregate snapshots, definitions and source notes. The Excel files contain values; the source and formula notes explain what can be reproduced.