Scenario Analysis Without False Precision
Low, base, and high lines look like uncertainty. They are not automatically probabilities, confidence limits, or forecasts.
01 / Method
A baseline need not be “most likely”
A scenario is a conditional answer: what does the model produce if a named set of assumptions holds? A forecast makes a claim about what is expected to happen. A statistical interval adds a probability or repeated-sampling interpretation. Those objects can coexist, but their labels and evidence cannot be exchanged.
EIA's Annual Energy Outlook 2026 is unusually explicit. Its Counterfactual Baseline is an experimental control. Side cases change uncertain inputs and policy or technology conditions around that control. EIA does not assign the selected cases probabilities.
That makes the common low/base/high visual grammar dangerous. A reader can easily treat the middle line as an expected forecast and the outer lines as confidence bounds. For AEO2026, that interpretation is unsupported.
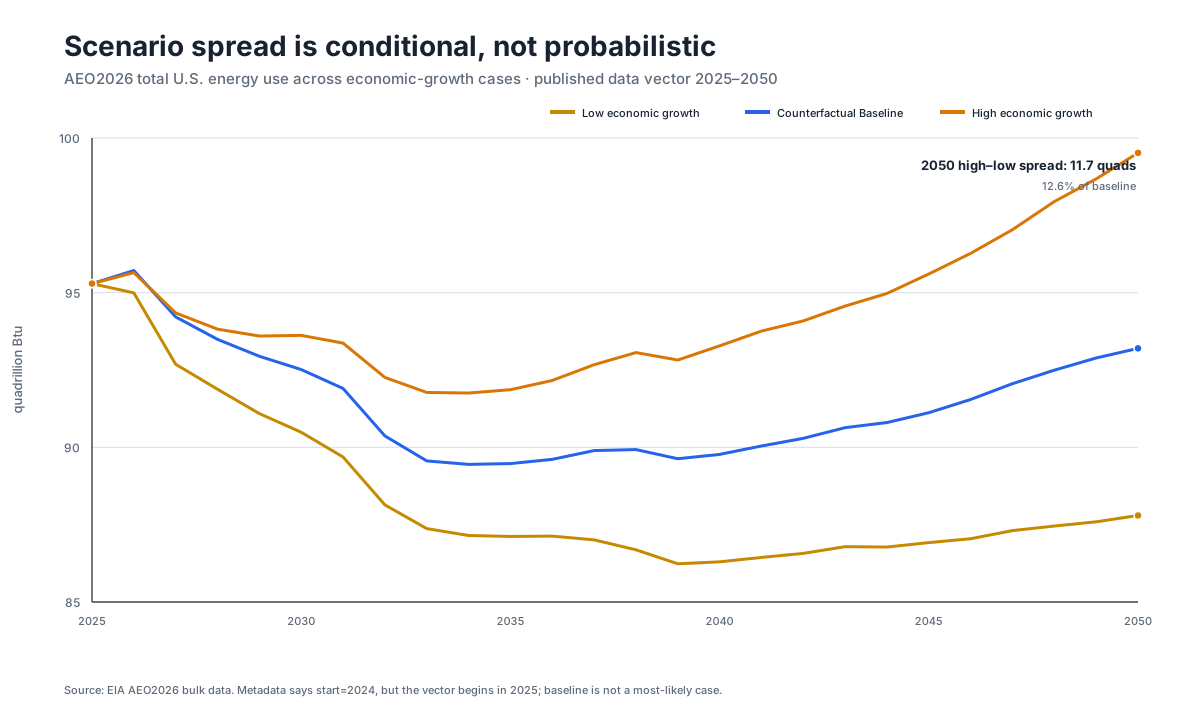
The selected total-energy-use records show why the distinction still matters numerically. In 2050, Low Economic Growth is 87.797 quads, Counterfactual Baseline is 93.200, and High Economic Growth is 99.519. The high-minus-low spread is 11.722 quads, or 12.58% of baseline.
That is a useful sensitivity result: economic-growth assumptions materially separate the modeled paths by 2050. It is not evidence that actual energy use has a specified chance of falling inside the range. Other policy, technology, demand, supply, and model-form uncertainties remain outside this three-case comparison.
02 / Method
Name the assumption, starting value, and decision rule
A transparent scenario table needs at least:
- source and vintage of the starting observation;
- the input changed in each case;
- the assumptions held constant;
- calculation horizon and formula;
- output unit;
- decision threshold;
- probability status—often
not_published.
The F01 population fixture demonstrates this structure. It starts from either Census Vintage 2024 or Vintage 2025 national population for 2024. The base annual rate is V2025's published 2023–2024 growth. Low subtracts 0.5 percentage point; high adds 0.5 point. Each rate is held constant through 2030.
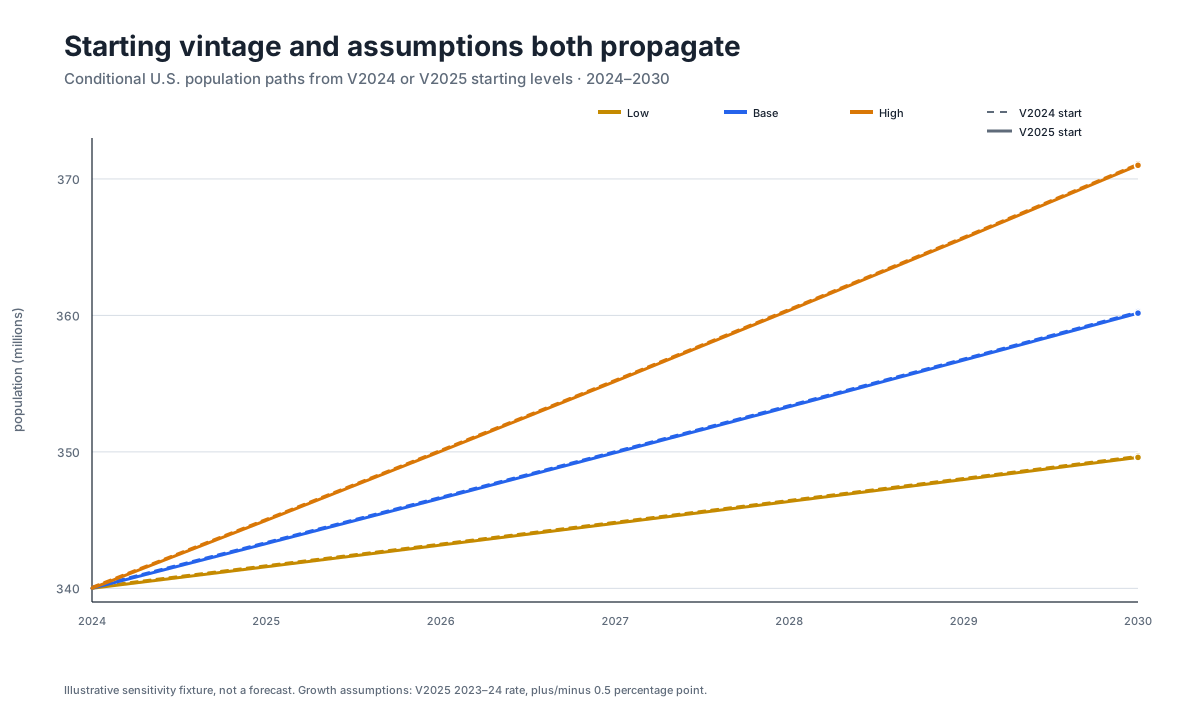
For the V2025 start, the 2030 paths are 349.60 million, 360.17 million, and 371.00 million. Under a declared question—“is 2030 at least 5% above the 2024 start?”—low says no and base/high say yes. A single base extrapolation would conceal that decision sensitivity.
The fixture is not a demographic forecast. Constant rates omit births, deaths, migration structure, policy, and shocks. The assumptions are chosen to test the method, not calibrated as quantiles.
03 / Method
Separate starting-data revision from scenario spread
The population grid crosses two axes: two published starting vintages and three growth assumptions. Those are different uncertainties.
The base 2030 result differs by about 114 thousand depending on whether it starts from V2024 or V2025. The V2025 high-minus-low spread is about 21.4 million. In this fixture, starting-vintage uncertainty is small relative to the selected assumption spread. That magnitude comparison does not justify merging them. One layer asks which published starting level is used; the other asks what happens under changed future assumptions.
An unlabeled band would erase that distinction and could double-count or falsely probability-weight the layers. Use line style or facets for vintage and named lines for assumptions. Add a statistical interval only if a defensible probability model exists.
04 / Method
Metadata can overstate the available history
Scenario pipelines need the same skepticism as observation pipelines. The three selected EIA records declare start=2024 and lastHistoricalPeriod=2024, yet the actual data vectors contain 2025–2050 only. F01 did not synthesize 2024 from the metadata bound.
This matters because a scenario chart often splices history and projections. A safe handoff requires an actual historical observation, a compatible modeled concept, and an explicit junction rule. Metadata labels alone do not supply that bridge.
05 / Method
A five-part honesty check
Before publishing a scenario chart, ask:
- Are the cases predictions, sensitivity tests, or formal probabilistic draws?
- What exact assumptions differ, and which remain fixed?
- What source vintage anchors the path?
- Does the decision conclusion change across cases?
- Which uncertainty layers are not represented?
If probabilities are absent, say so in the chart and data. If a baseline is a control, call it a control. If bounds are analyst-selected, call them assumptions. Precision in the arithmetic cannot compensate for ambiguity in the claim.
06 / Evidence
Evidence
- EIA case values and spread
- EIA record metadata
- Population assumptions
- Population scenario grid
- Scenario interpretation counterevidence
- 01The Revision Risk That a Tiny Percentage Hides
A public data revision risk guide showing why small level changes can still flip direction, thresholds, rankings, and the conclusion attached to a metric.
- 02A Chart Should Carry Its Own Chain of Custody
A chart provenance guide for contracts, backing tables, source-row lineage, deterministic manifests, accessible figures, outliers, and scenario boundaries.
- 03Research & Technical Writing
Technical research by Sulayman Bowles on WebGL engineering, dithering shaders, AI website design, market systems, and evidence-led audits.
- 01Annual Energy Outlook 2026 Case Descriptions
The accepted F01/05_scenario_analysis_without_false_precision packet cites this source for Case definitions and experimental-control role. The packet preserves the frozen locator, retrieval record, and claim mapping.
Checked 2026-08-10 - 02Annual Energy Outlook 2026 bulk archive
The accepted F01/05_scenario_analysis_without_false_precision packet cites this source for Scenario values and record metadata. The packet preserves the frozen locator, retrieval record, and claim mapping.
Checked 2026-08-10 - 03Annual Energy Outlook 2026 Narrative
The accepted F01/05_scenario_analysis_without_false_precision packet cites this source for Baseline and side-case interpretation. The packet preserves the frozen locator, retrieval record, and claim mapping.
Checked 2026-08-10 - 04Annual Energy Outlook Retrospective 2025
The accepted F01/05_scenario_analysis_without_false_precision packet cites this source for Conditional projection context. The packet preserves the frozen locator, retrieval record, and claim mapping.
Checked 2026-08-10 - 05NST-EST2025-ALLDATA CSV
The accepted F01/05_scenario_analysis_without_false_precision packet cites this source for V2025 population starting value and rate. The packet preserves the frozen locator, retrieval record, and claim mapping.
Checked 2026-08-10 - 06NST-EST2024-ALLDATA CSV
The accepted F01/05_scenario_analysis_without_false_precision packet cites this source for Alternative starting vintage. The packet preserves the frozen locator, retrieval record, and claim mapping.
Checked 2026-08-10