The Revision Risk That a Tiny Percentage Hides
A revision can be small relative to a level and decisive relative to the claim made about that level.
01 / Method
The denominator changes the story
That is the central result from a frozen comparison of BLS QCEW releases, Census population vintages, and BEA GDP estimate stages. Across 311 matched earlier/later pairs, most conclusions stayed stable. But sign, threshold, and rank changes appeared in every empirical bundle. The right question is not “how large was the revision?” It is “could this revision change the decision rule attached to the number?”
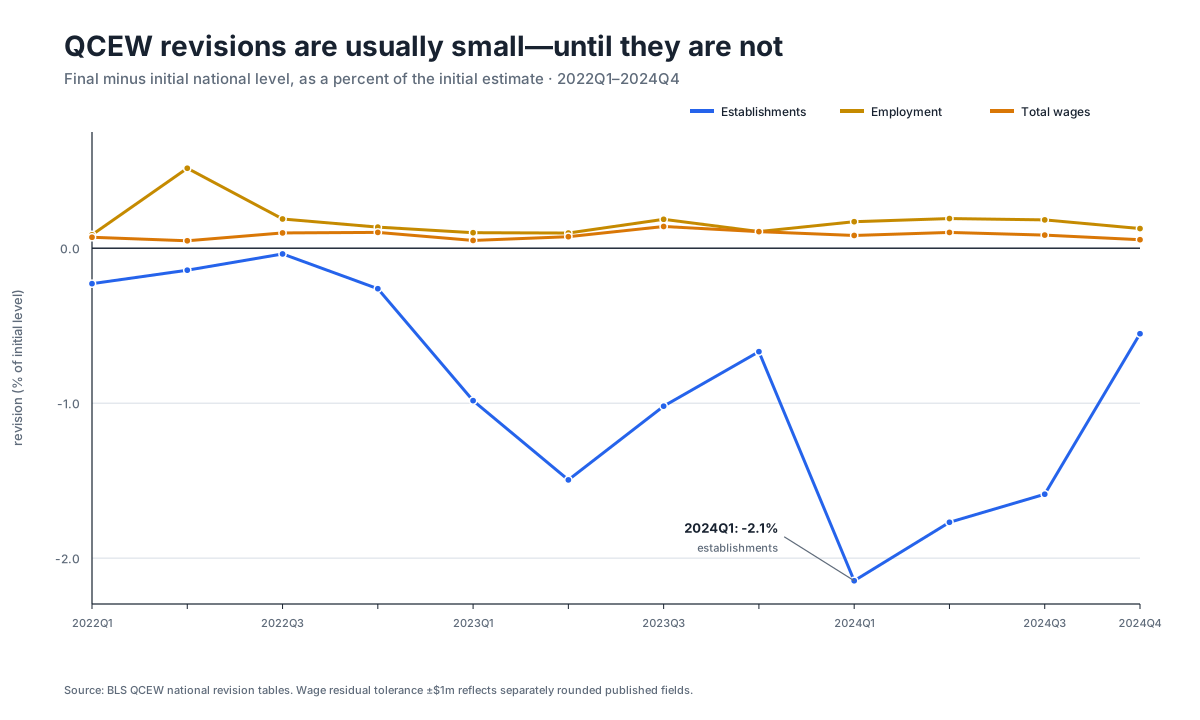
Consider national QCEW establishments in 2024Q4. The final level was 0.552% below the initial level. That can sound modest. Yet the adjacent-quarter change moved from −0.260% to +0.789%—a 1.050 percentage-point revision and a direction flip.
In 2024Q1, the final establishment level was 2.146% below the initial value. The adjacent-quarter story changed from +0.652% to −0.846%. Across the 11 comparable establishment transitions, two directions changed and one result crossed the declared above-1% threshold.
Employment and wages are the necessary counterweight. Their median level revisions were 0.154% and 0.083%, and none of their 11 adjacent-growth directions changed. This is not evidence that every revised series is narratively unstable. It is evidence that level-relative percentages alone do not measure narrative risk.
One useful diagnostic is the revision-to-change ratio: absolute revision in the growth metric divided by the magnitude of the originally published change, with a denominator floor near zero. For establishments, the median ratio was 68.2%; the maximum was 403.1%. The diagnostic should not be fetishized—it is unstable around tiny denominators—but it tells an editor when a small-looking level revision is large compared with the movement being described.
02 / Method
Population rankings have vintage risk
The Census comparison matched Vintage 2024 and Vintage 2025 for 50 states plus DC over reference years 2020–2024. Across 255 state-year levels, the median absolute revision was only 0.031%. The maximum was 1.558%.
That pooled median hides a time pattern. The median was 0.004% for 2020 and 0.171% for 2024. It also hides outliers. DC's 2024 level moved down by 10,940 people, or 1.558%, and its annual growth rank moved from first to twelfth. New York's 2024 estimate moved up 134,171 people, pushing its growth from 0.658% to 1.086%—across a 1% threshold.
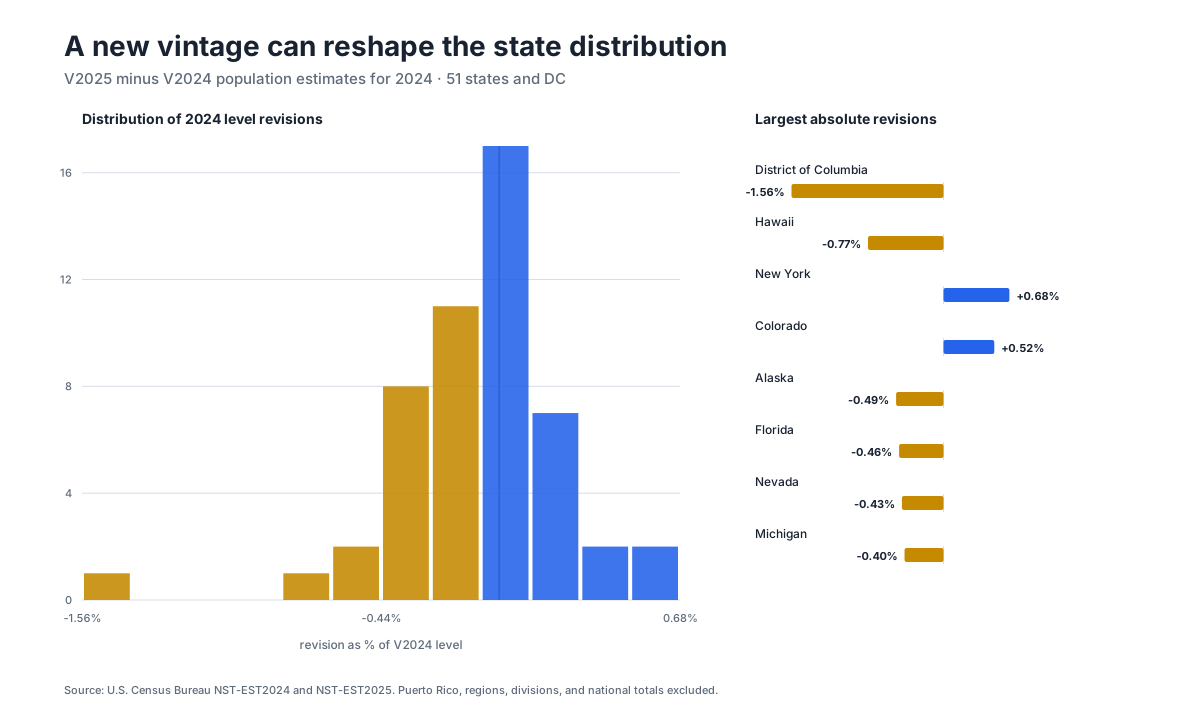
Across 204 state-year growth comparisons, five directions changed, eight crossed the 1% rule, and six entered or left the top 10. The stable counts are just as important: 199 directions, 196 thresholds, and 198 top-10 classifications did not change. A revision badge should therefore say what changed, not simply flash “data revised.”
03 / Method
GDP first releases have threshold exposure
The BEA frame follows 20 quarters of real GDP growth from the initial eligible estimate to the latest value available in a July 2026 workbook. The median absolute revision was 0.35 percentage point; the maximum was 1.8 points.
One quarter crossed zero. The 2022Q2 advance estimate reported −0.9% annualized growth; the latest available value was +0.6%. Four of the 20 quarters changed truth value under a strict “growth > 2%” rule.
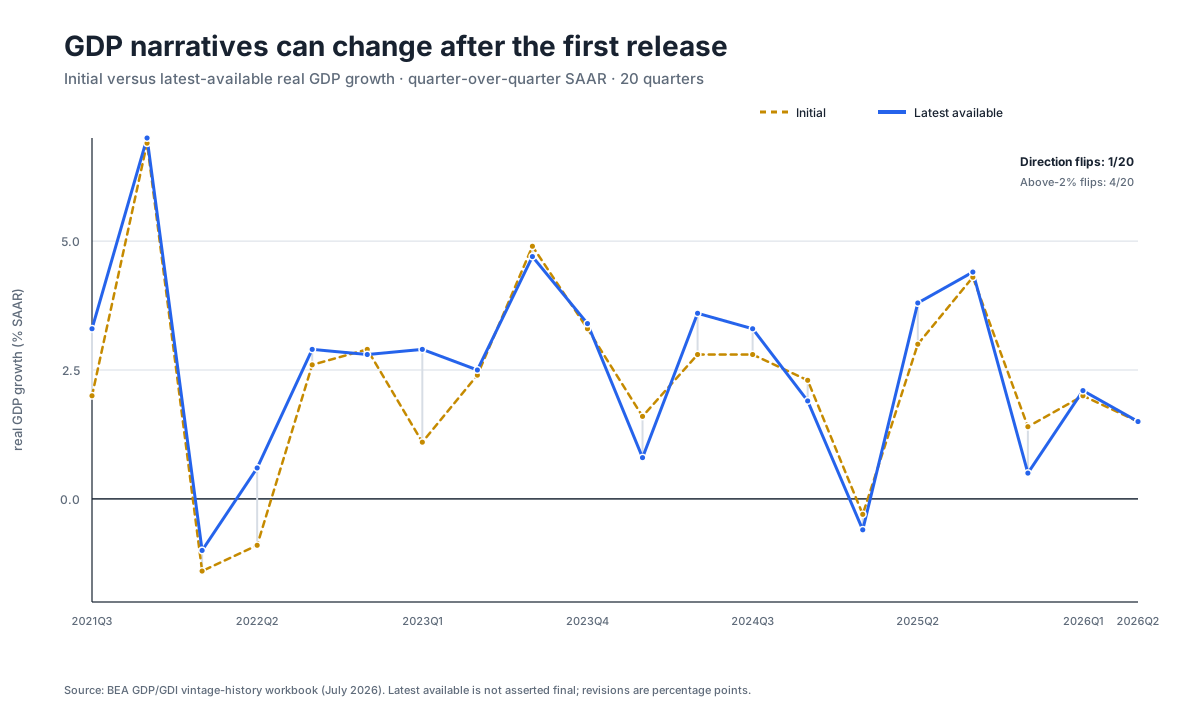
That four-of-20 count is not a law of GDP. Two cases begin exactly at 2.0% and move above it. A >=2% rule, a tolerance, or a qualitative “near 2%” category would yield a different result. The threshold belongs in the evidence receipt.
04 / Method
A practical revision-risk card
For any public claim based on a preliminary or versioned series, save:
- the exact release and retrieval date;
- the best-current comparator and its stage;
- absolute revision and percent of earlier level;
- revision to any growth/rate transform in percentage points;
- sign, threshold, and rank membership under the declared decision rule;
- the number of comparable observations and named outliers;
- counterevidence: how many conclusions remained stable.
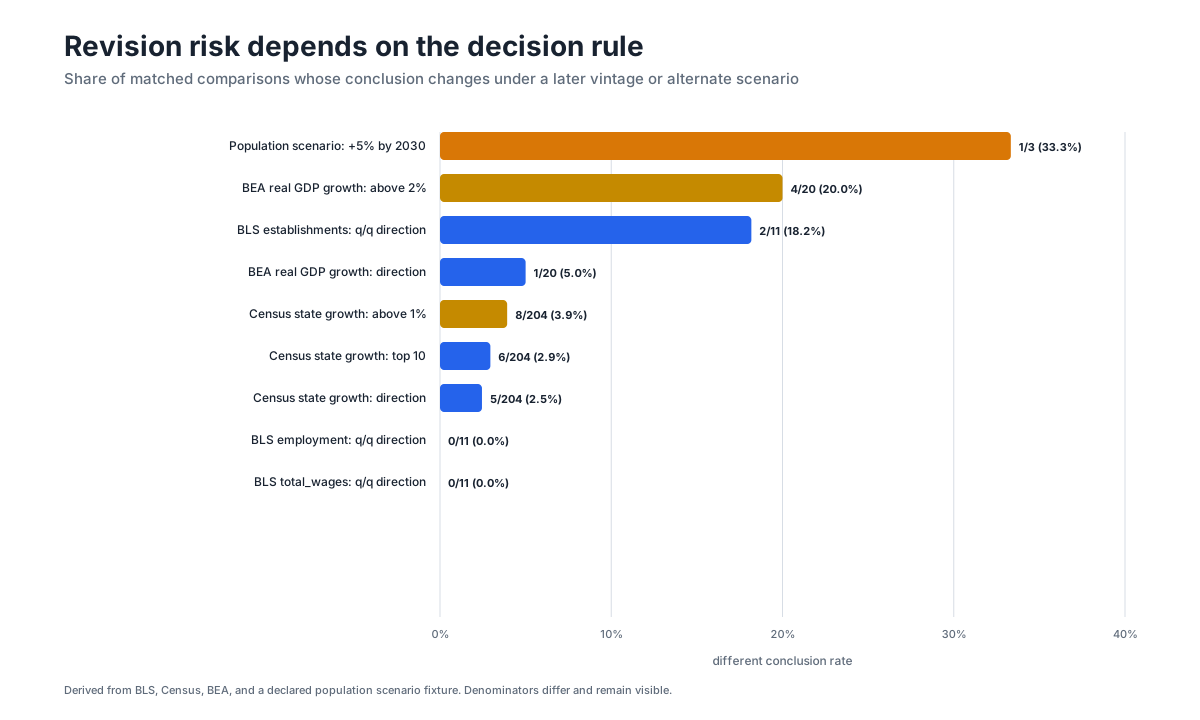
Do not estimate a universal “revision risk” from these rates. The bundles are purposive case studies, the BLS input is a 36-row national excerpt, and BEA latest-available is not always final. The contribution is the measurement pattern: attach revision risk to the decision layer, preserve both releases, and report a distribution rather than one reassuring average.
05 / Evidence
Evidence
- Cross-bundle revision summary
- Conclusion-fragility rules and denominators
- BLS metrics
- Census metrics
- BEA metrics
- Counterevidence
- 01When Official Numbers Disagree, Reconcile the Question First
When official numbers disagree, this guide reconciles concepts, vintages, grains, and release states before choosing or transforming a value.
- 02A Chart Should Carry Its Own Chain of Custody
A chart provenance guide for contracts, backing tables, source-row lineage, deterministic manifests, accessible figures, outliers, and scenario boundaries.
- 03Research & Technical Writing
Technical research by Sulayman Bowles on WebGL engineering, dithering shaders, AI website design, market systems, and evidence-led audits.
- 01QCEW Revisions
The accepted F01/02_data_revision_risk packet cites this source for QCEW schedule and official tables. The packet preserves the frozen locator, retrieval record, and claim mapping.
Checked 2026-08-10 - 02NST-EST2025-ALLDATA CSV
The accepted F01/02_data_revision_risk packet cites this source for Later Census vintage. The packet preserves the frozen locator, retrieval record, and claim mapping.
Checked 2026-08-10 - 03NST-EST2024-ALLDATA CSV
The accepted F01/02_data_revision_risk packet cites this source for Earlier Census vintage. The packet preserves the frozen locator, retrieval record, and claim mapping.
Checked 2026-08-10 - 04Vintage History of Quarterly GDP and GDI Estimates
The accepted F01/02_data_revision_risk packet cites this source for BEA estimate stages and values. The packet preserves the frozen locator, retrieval record, and claim mapping.
Checked 2026-08-10 - 05GDP Revision Information
The accepted F01/02_data_revision_risk packet cites this source for BEA revision context. The packet preserves the frozen locator, retrieval record, and claim mapping.
Checked 2026-08-10