A Chart Should Carry Its Own Chain of Custody
A source line under a chart is not provenance. “Source: Census Bureau” does not tell a reviewer which file, vintage, geography frame, field, transformation, or missingness rule produced a mark.
01 / Method
Start with a chart contract
A research chart should behave like a release artifact: it needs a contract before rendering, a data manifest after rendering, and a path back to the exact source rows.
Before plotting, write down:
- the question and intended takeaway;
- the observation grain and minimum data sufficiency;
- the fields and units;
- the earlier/later vintage rule;
- the decision threshold, if any;
- the scale and reference line;
- the backing table and output filename.
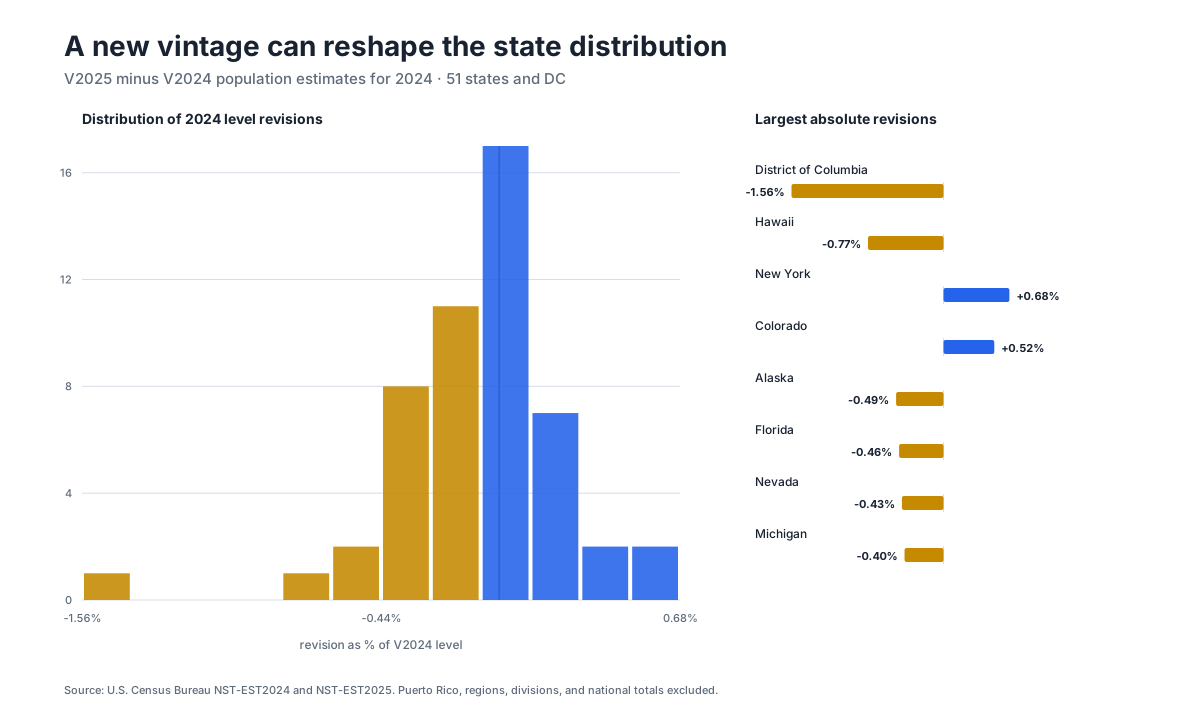
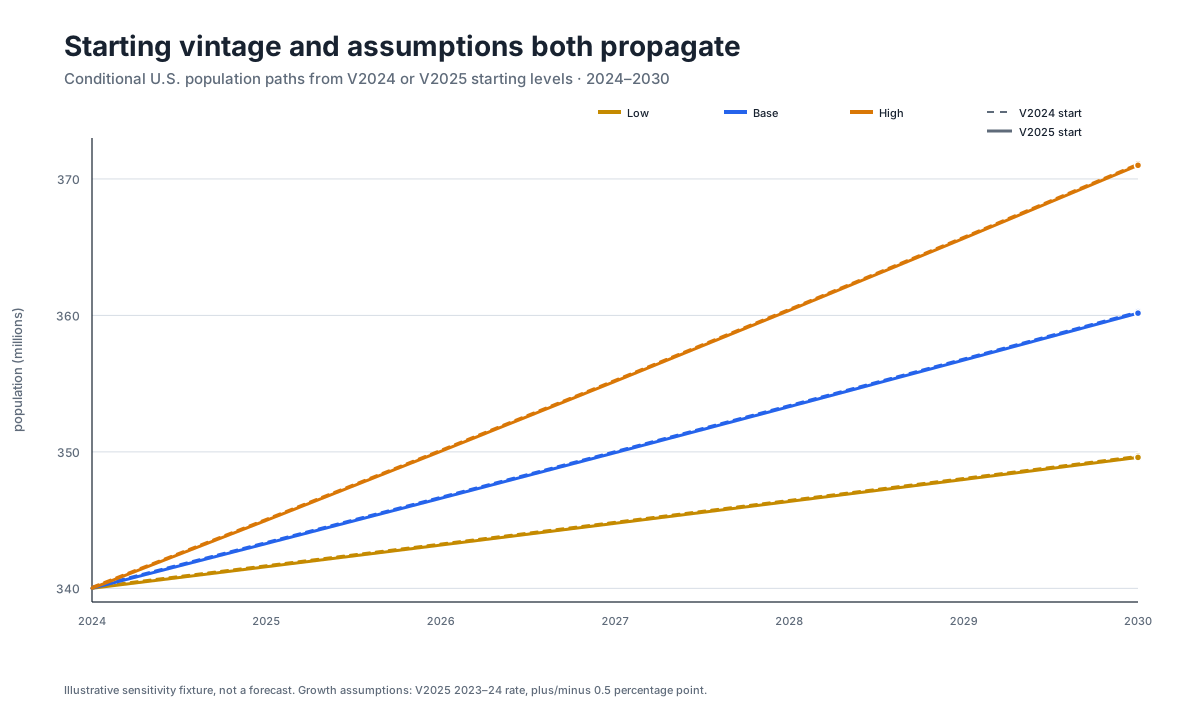
This prevents the renderer from quietly redefining the analysis. In F01, the Census distribution chart was fixed to 51 state/DC observations for reference year 2024. National totals, regions, divisions, and Puerto Rico are excluded. The population scenario chart uses seven annual points because it is a discrete 2024–2030 sensitivity fixture, not because seven points are usually enough for a trend claim.
02 / Method
Bind the image to a table
Every F01 SVG has an entry in FIGURE_MANIFEST.csv: figure ID, chart-contract ID, filename, title, source tables, unit, dimensions, accessibility state, byte size, and SHA-256 hash.
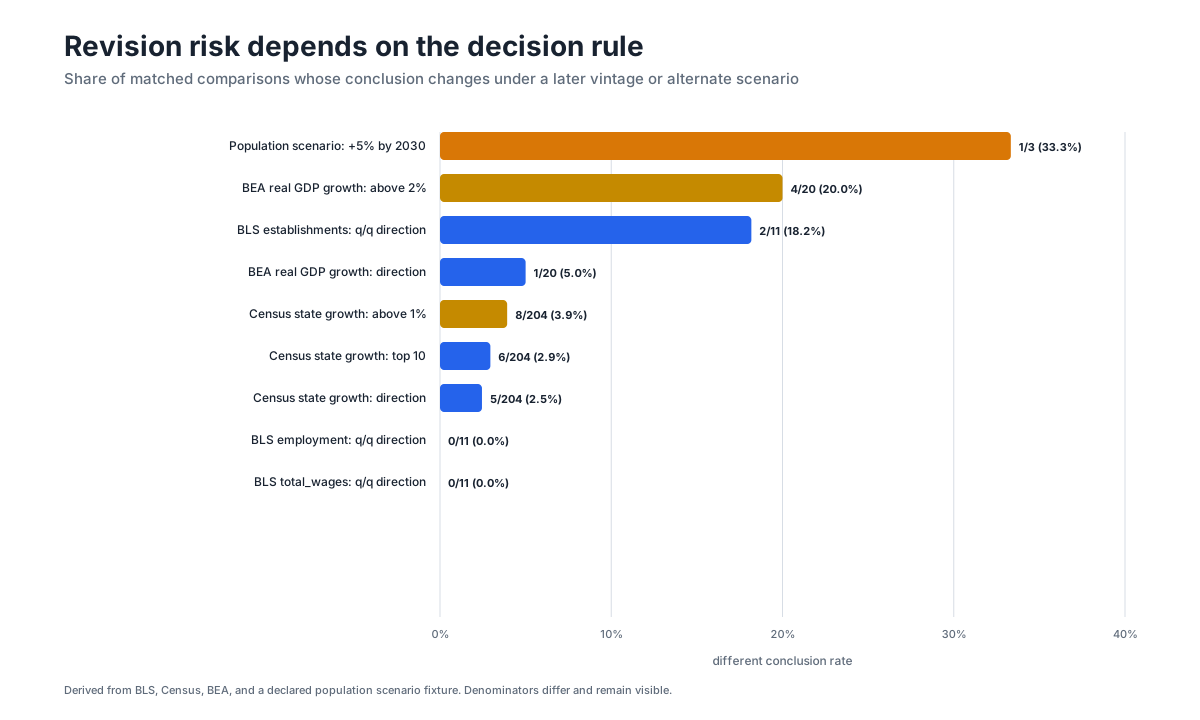
The chart never becomes the only copy of the data. Its backing table retains exact values and denominators. For the decision-fragility chart, a label such as “BEA above 2%” links to a row containing 20 comparisons, four different conclusions, a 20% rate, and the strict >2.0% rule. A reviewer can challenge the rule without reverse-engineering pixels.
03 / Method
Preserve outliers instead of designing them away
A pooled average would hide the state revision distribution. The Census chart therefore combines a histogram with named largest absolute revisions. It shows that a concentrated distribution can coexist with a 1.558% DC outlier.
The QCEW chart uses a zero line and signed revisions. That makes negative outliers visible instead of plotting only absolute error. It also carries a method note about the measure-specific $1 million rounding tolerance for wages.
The BEA chart connects initial and latest-available values and labels the rate as quarter-over-quarter SAAR. “Latest available” is deliberate: the workbook's publisher stages vary, and not every line can be called final.
04 / Method
Use redundancy, not color alone
An evidence chart must remain interpretable when printed, viewed by a color-deficient reader, or extracted from its original context. F01 uses direct series labels, solid versus dashed lines, marker positions, fixed ordering, and source notes in addition to color. Every SVG includes an accessible <title> and <desc>.
Visual QA is separate from XML validity. A file can parse and still clip text or collapse at reduced width. The release checklist should inspect full-size and mobile-width raster previews, compare visible values to backing tables, and verify title, unit, source, grain, and reference line.
05 / Method
Keep scenario visual grammar honest
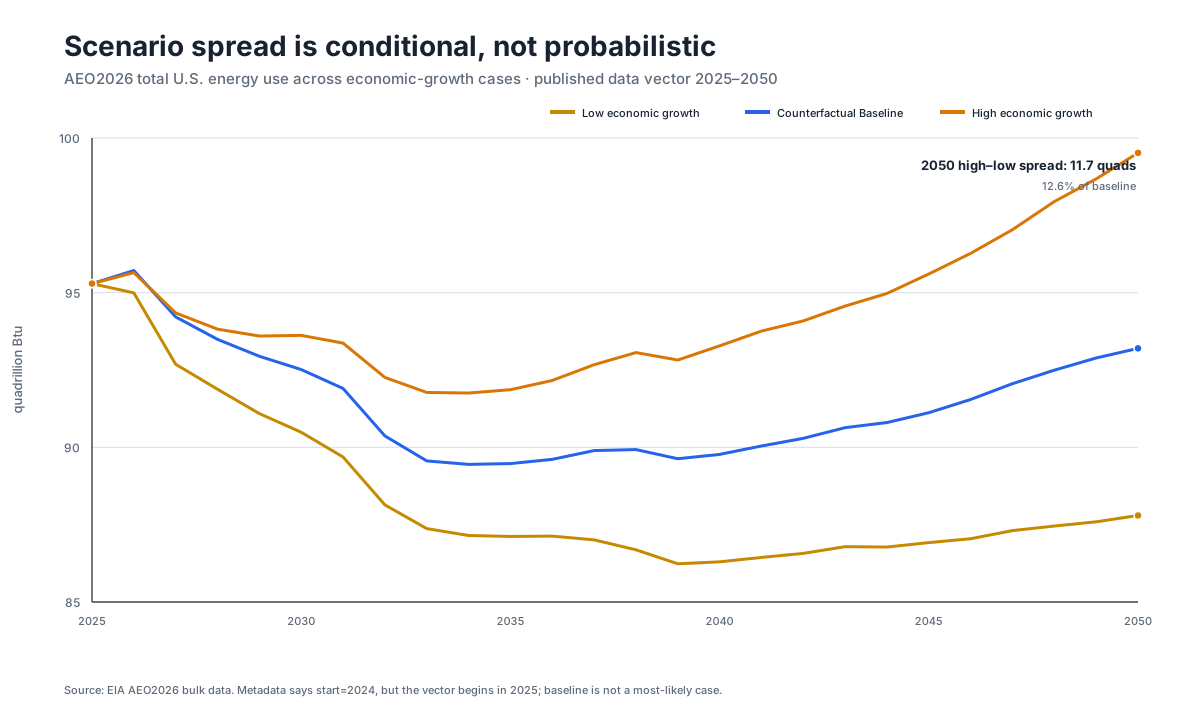
A scenario chart is especially easy to overstate. EIA's selected economic-growth cases have no assigned probabilities, and the Counterfactual Baseline is an experimental control rather than the most-likely future. The chart uses three named lines and an explicit note. It does not use a shaded confidence ribbon.
The controlled population chart encodes starting-vintage differences with line style and assumption differences with color. That prevents one unlabeled band from mixing data revision with scenario uncertainty.
06 / Method
The minimum provenance manifest
For a portable chart, store:
- figure and chart-contract IDs;
- exact source-table paths and hashes;
- raw input hashes and retrieval dates;
- transform IDs and parent observation IDs;
- units, grain, filters, and decision rule;
- renderer version and deterministic dimensions;
- accessibility and visual-QA status;
- limitations and counterevidence.
The purpose is not bureaucratic completeness. It is to make the chart corrigible. When a later vintage arrives, an editor should be able to regenerate the figure, identify which conclusion changed, and retain the chart that readers originally saw.
07 / Evidence
Evidence
- 01A Reproducible Public-Data Model Is More Than a Notebook That Runs
A reproducible public data model guide to frozen source bytes, versioned observations, explicit transforms, deterministic charts, and reviewable lineage.
- 02Scenario Analysis Without False Precision
Scenario analysis without false precision separates conditional cases, forecasts, probability intervals, starting vintages, and decision-sensitive assumptions.
- 03Research & Technical Writing
Technical research by Sulayman Bowles on WebGL engineering, dithering shaders, AI website design, market systems, and evidence-led audits.
- 01QCEW Revisions
The accepted F01/04_chart_provenance packet cites this source for Revision-table source and geography footnote. The packet preserves the frozen locator, retrieval record, and claim mapping.
Checked 2026-08-10 - 02NST-EST2025-ALLDATA CSV
The accepted F01/04_chart_provenance packet cites this source for Census later vintage. The packet preserves the frozen locator, retrieval record, and claim mapping.
Checked 2026-08-10 - 03NST-EST2024-ALLDATA CSV
The accepted F01/04_chart_provenance packet cites this source for Census earlier vintage. The packet preserves the frozen locator, retrieval record, and claim mapping.
Checked 2026-08-10 - 04Vintage History of Quarterly GDP and GDI Estimates
The accepted F01/04_chart_provenance packet cites this source for BEA chart values and stages. The packet preserves the frozen locator, retrieval record, and claim mapping.
Checked 2026-08-10 - 05Annual Energy Outlook 2026 Case Descriptions
The accepted F01/04_chart_provenance packet cites this source for Scenario labels and interpretation. The packet preserves the frozen locator, retrieval record, and claim mapping.
Checked 2026-08-10 - 06Annual Energy Outlook 2026 bulk archive
The accepted F01/04_chart_provenance packet cites this source for Scenario chart values. The packet preserves the frozen locator, retrieval record, and claim mapping.
Checked 2026-08-10